Graphical Reporting capabilities
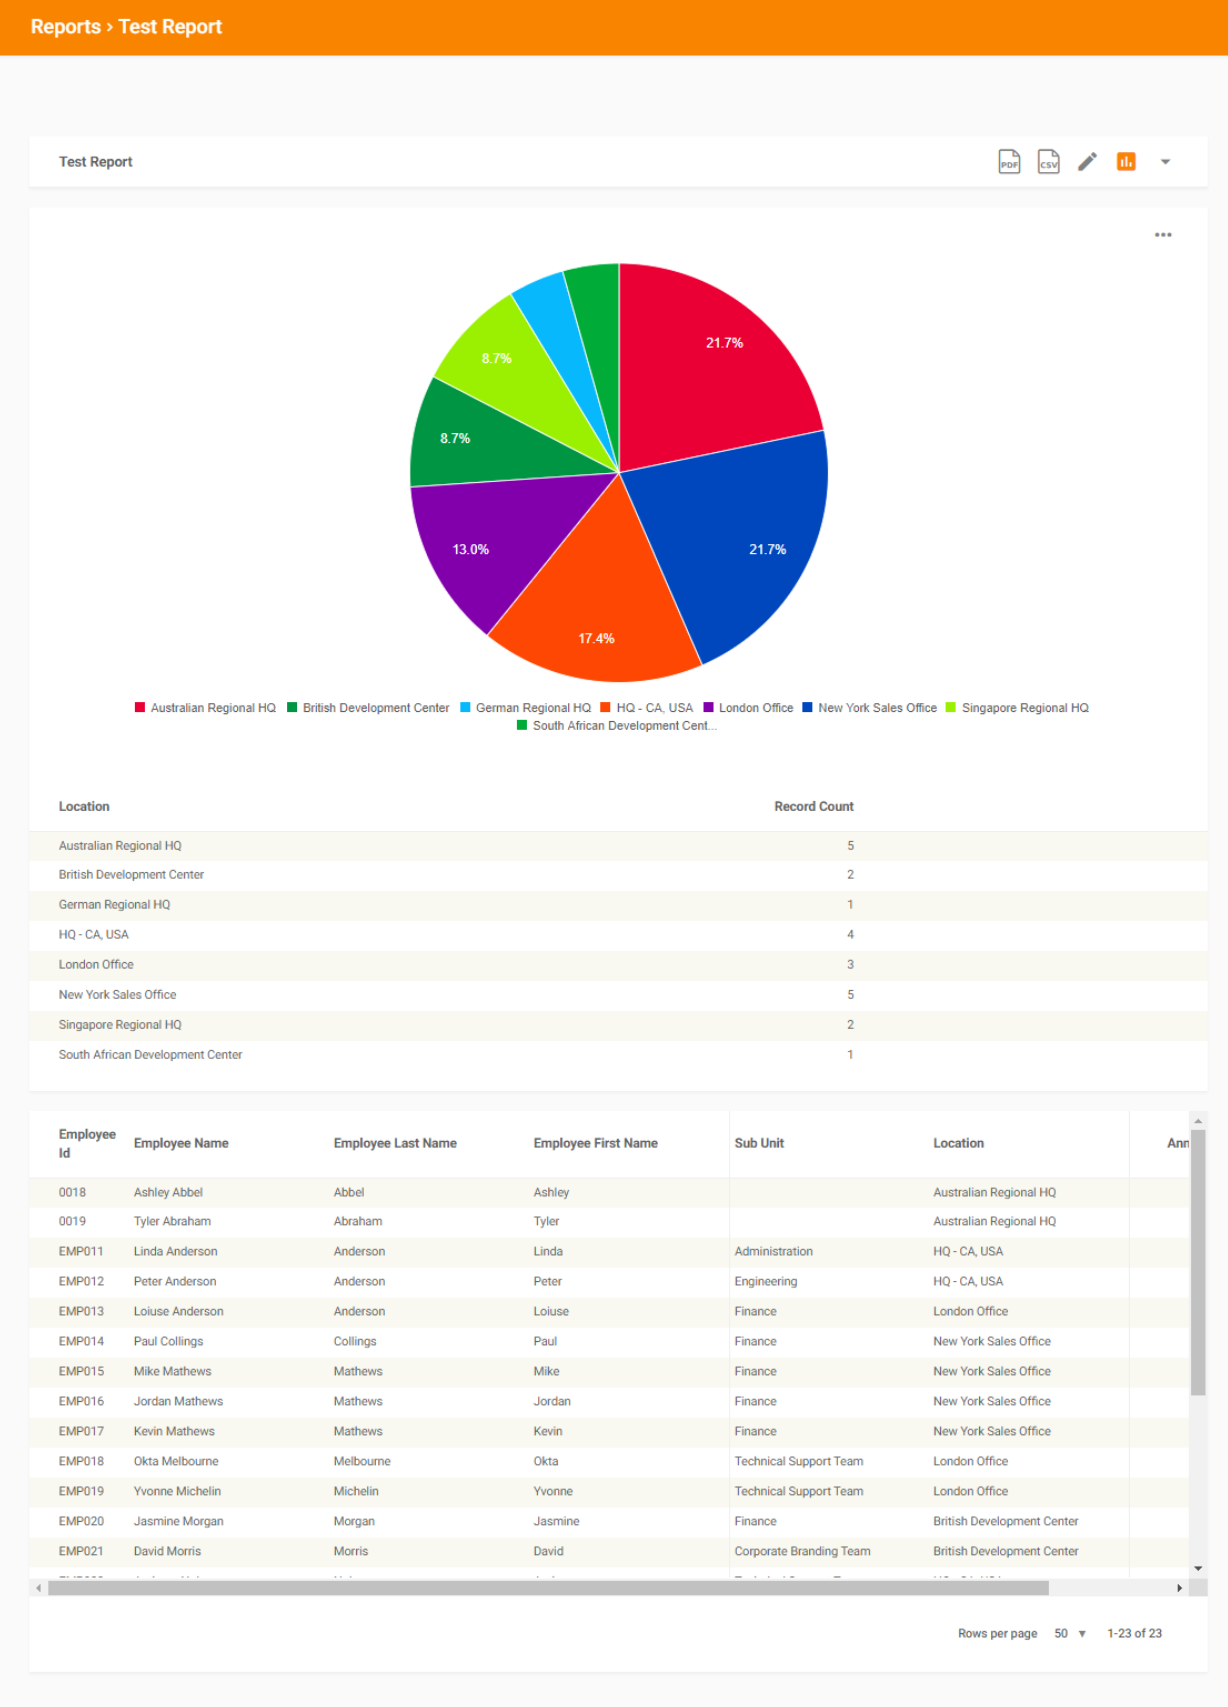
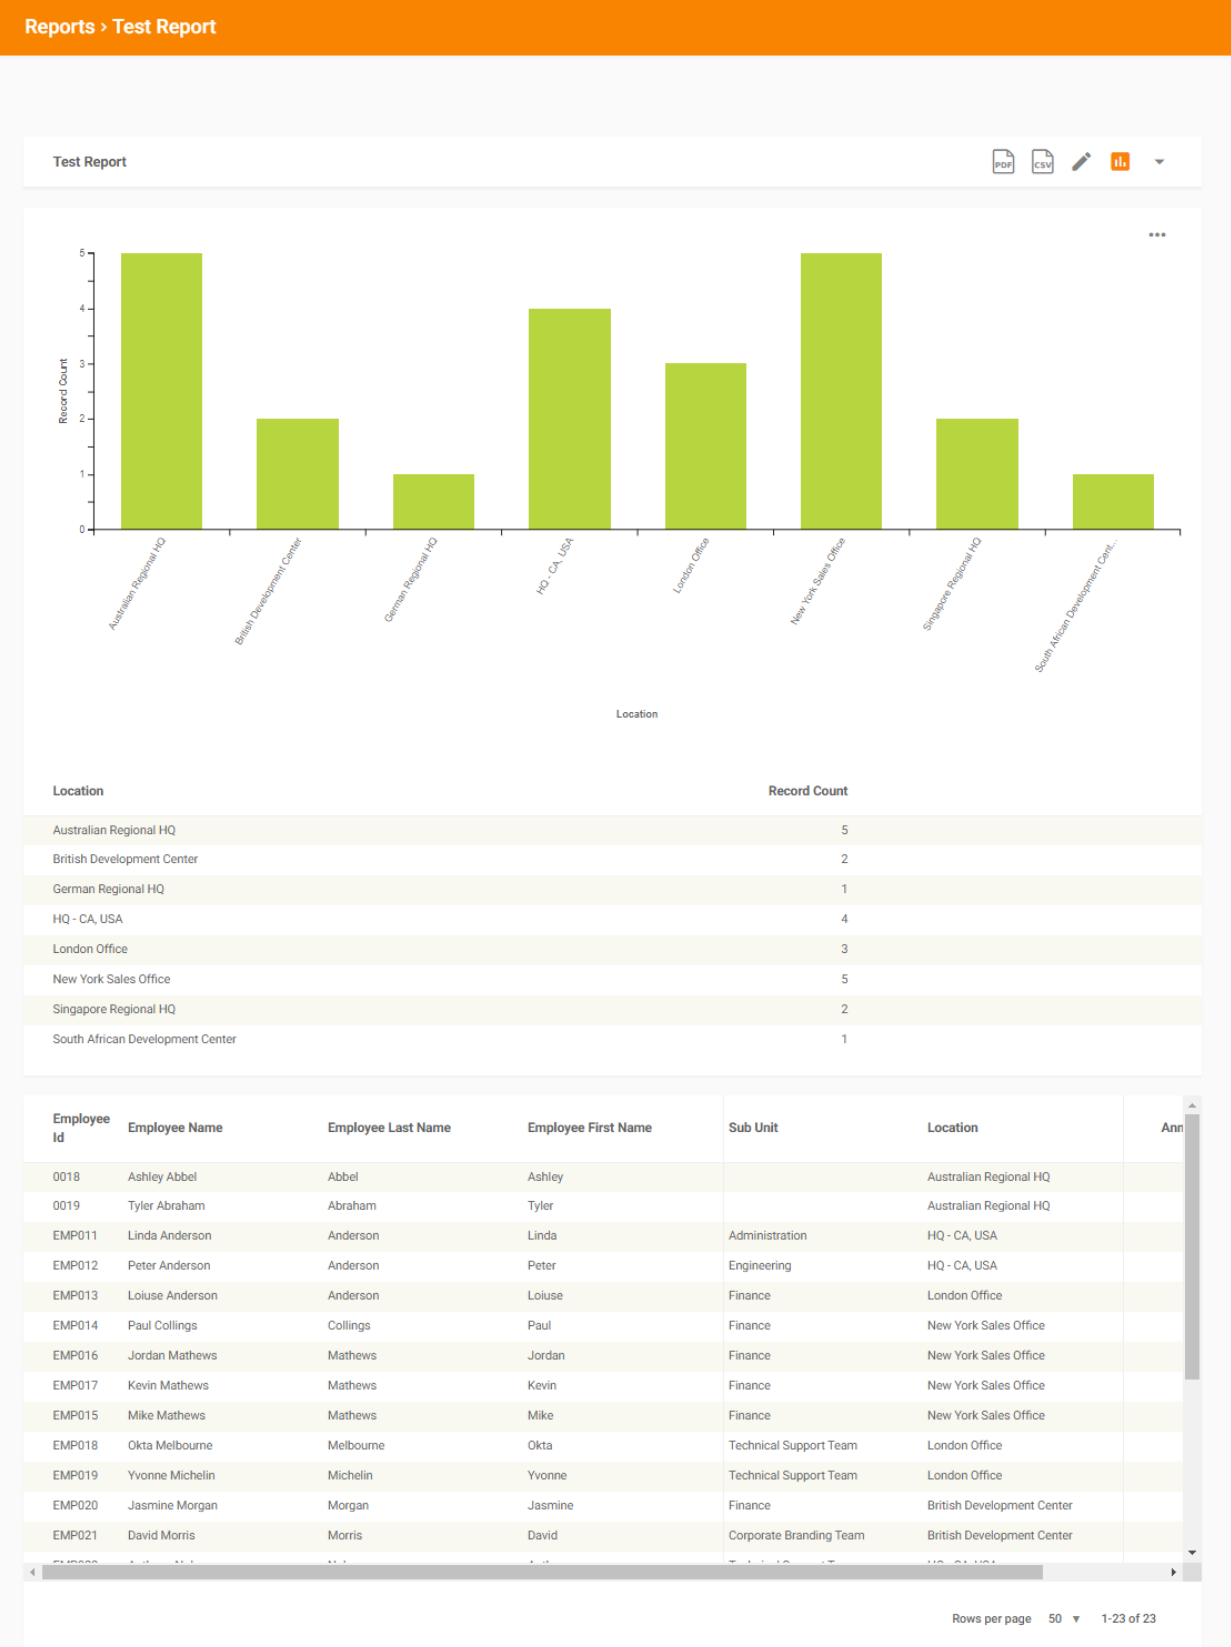
PIM reports have been expanded to facilitate the incorporation of pie and bar charts to allow for a visual representation of PIM report data. With this unique feature, the user can minimize the extra hours spent on spreadsheets and simply download the file to pdf or CSV and provide it to Management. A chart can be generated for both numeric and non-numeric display fields which have been selected for the PIM report.
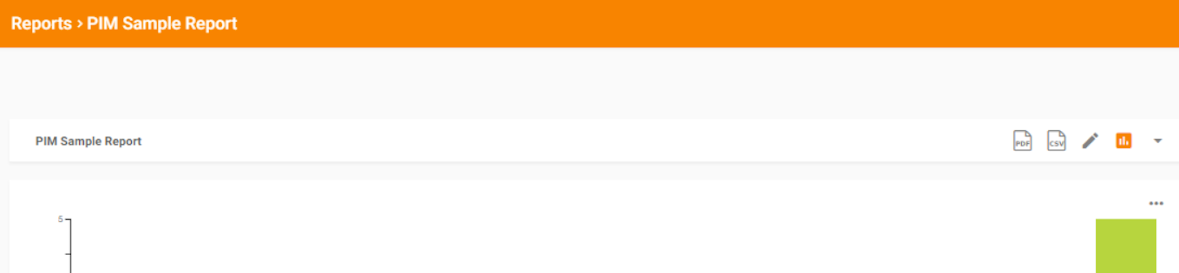
The “Show Chart” icon is visible once the user creates the PIM report. The icon ![]() is displayed in the top right corner. Once the user selects the show chart option, the system displays the options for the user to select the chart type and proceed with creating the chart by providing the chart settings to create the desired chart type.
is displayed in the top right corner. Once the user selects the show chart option, the system displays the options for the user to select the chart type and proceed with creating the chart by providing the chart settings to create the desired chart type.
Also, the system allows the user to make the summary table visible by enabling the ‘Show Summary table” option. If the user wants to hide the detailed data, there is an option to enable or disable the feature by selecting “Hide Detailed Data”. Both of these features are very useful for the user to help minimise extra work.
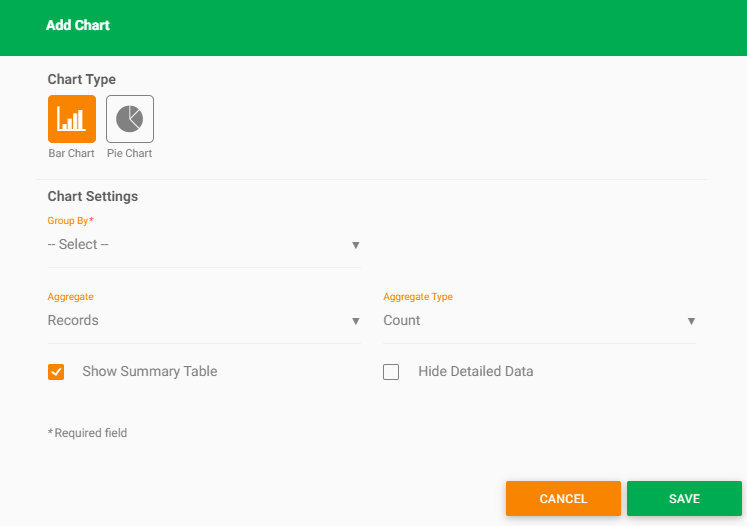
Bar Chart
Pie Chart